Silver at $70: The Asymmetric Setup, the Sixth Straight Deficit, and Why $300 Targets Are Now in Play
In Part 1 of this series, we walked through the macro setup driving gold’s pullback from the $5,595 January high to current levels around $4,577. The thesis was that the structural drivers powering this cycle — central bank accumulation, US fiscal arithmetic, BRICS reserve diversification, and the compounding geopolitical risk premium — are still in place. A 15% pullback inside that setup is a feature, not a bug. We extended that view a few days later in our analysis of the April 29 FOMC decision, where the most divided Fed vote in 34 years made the structural case for precious metals materially stronger.
This post is about silver, and the argument is sharper: silver is sitting in one of the most asymmetric setups we have seen in two decades. Three independent signals — the gold/silver ratio at roughly 65, a sixth consecutive annual physical deficit, and increasingly aggressive institutional price targets — all point in the same direction. When three independent signals agree, the position size matters more than the entry timing. We made the long-form bull case in is the gold and silver bull market dead — the short answer remains no.
Silver does not get the institutional airtime that gold does. There is no central bank silver bid. There is no World Silver Council producing quarterly reserve allocation outlooks. The metal is smaller, more volatile, and more cyclical, and it lives in the shadow of its more famous monetary cousin. That is exactly why the setup is asymmetric. The structural fundamentals are there. The flow is just beginning to rotate. That is the gap an asymmetric trade lives in. As we wrote in the price of gold leads, but silver stampedes in a bull market, the back half of every precious metals cycle has belonged to silver.
Where silver actually sits
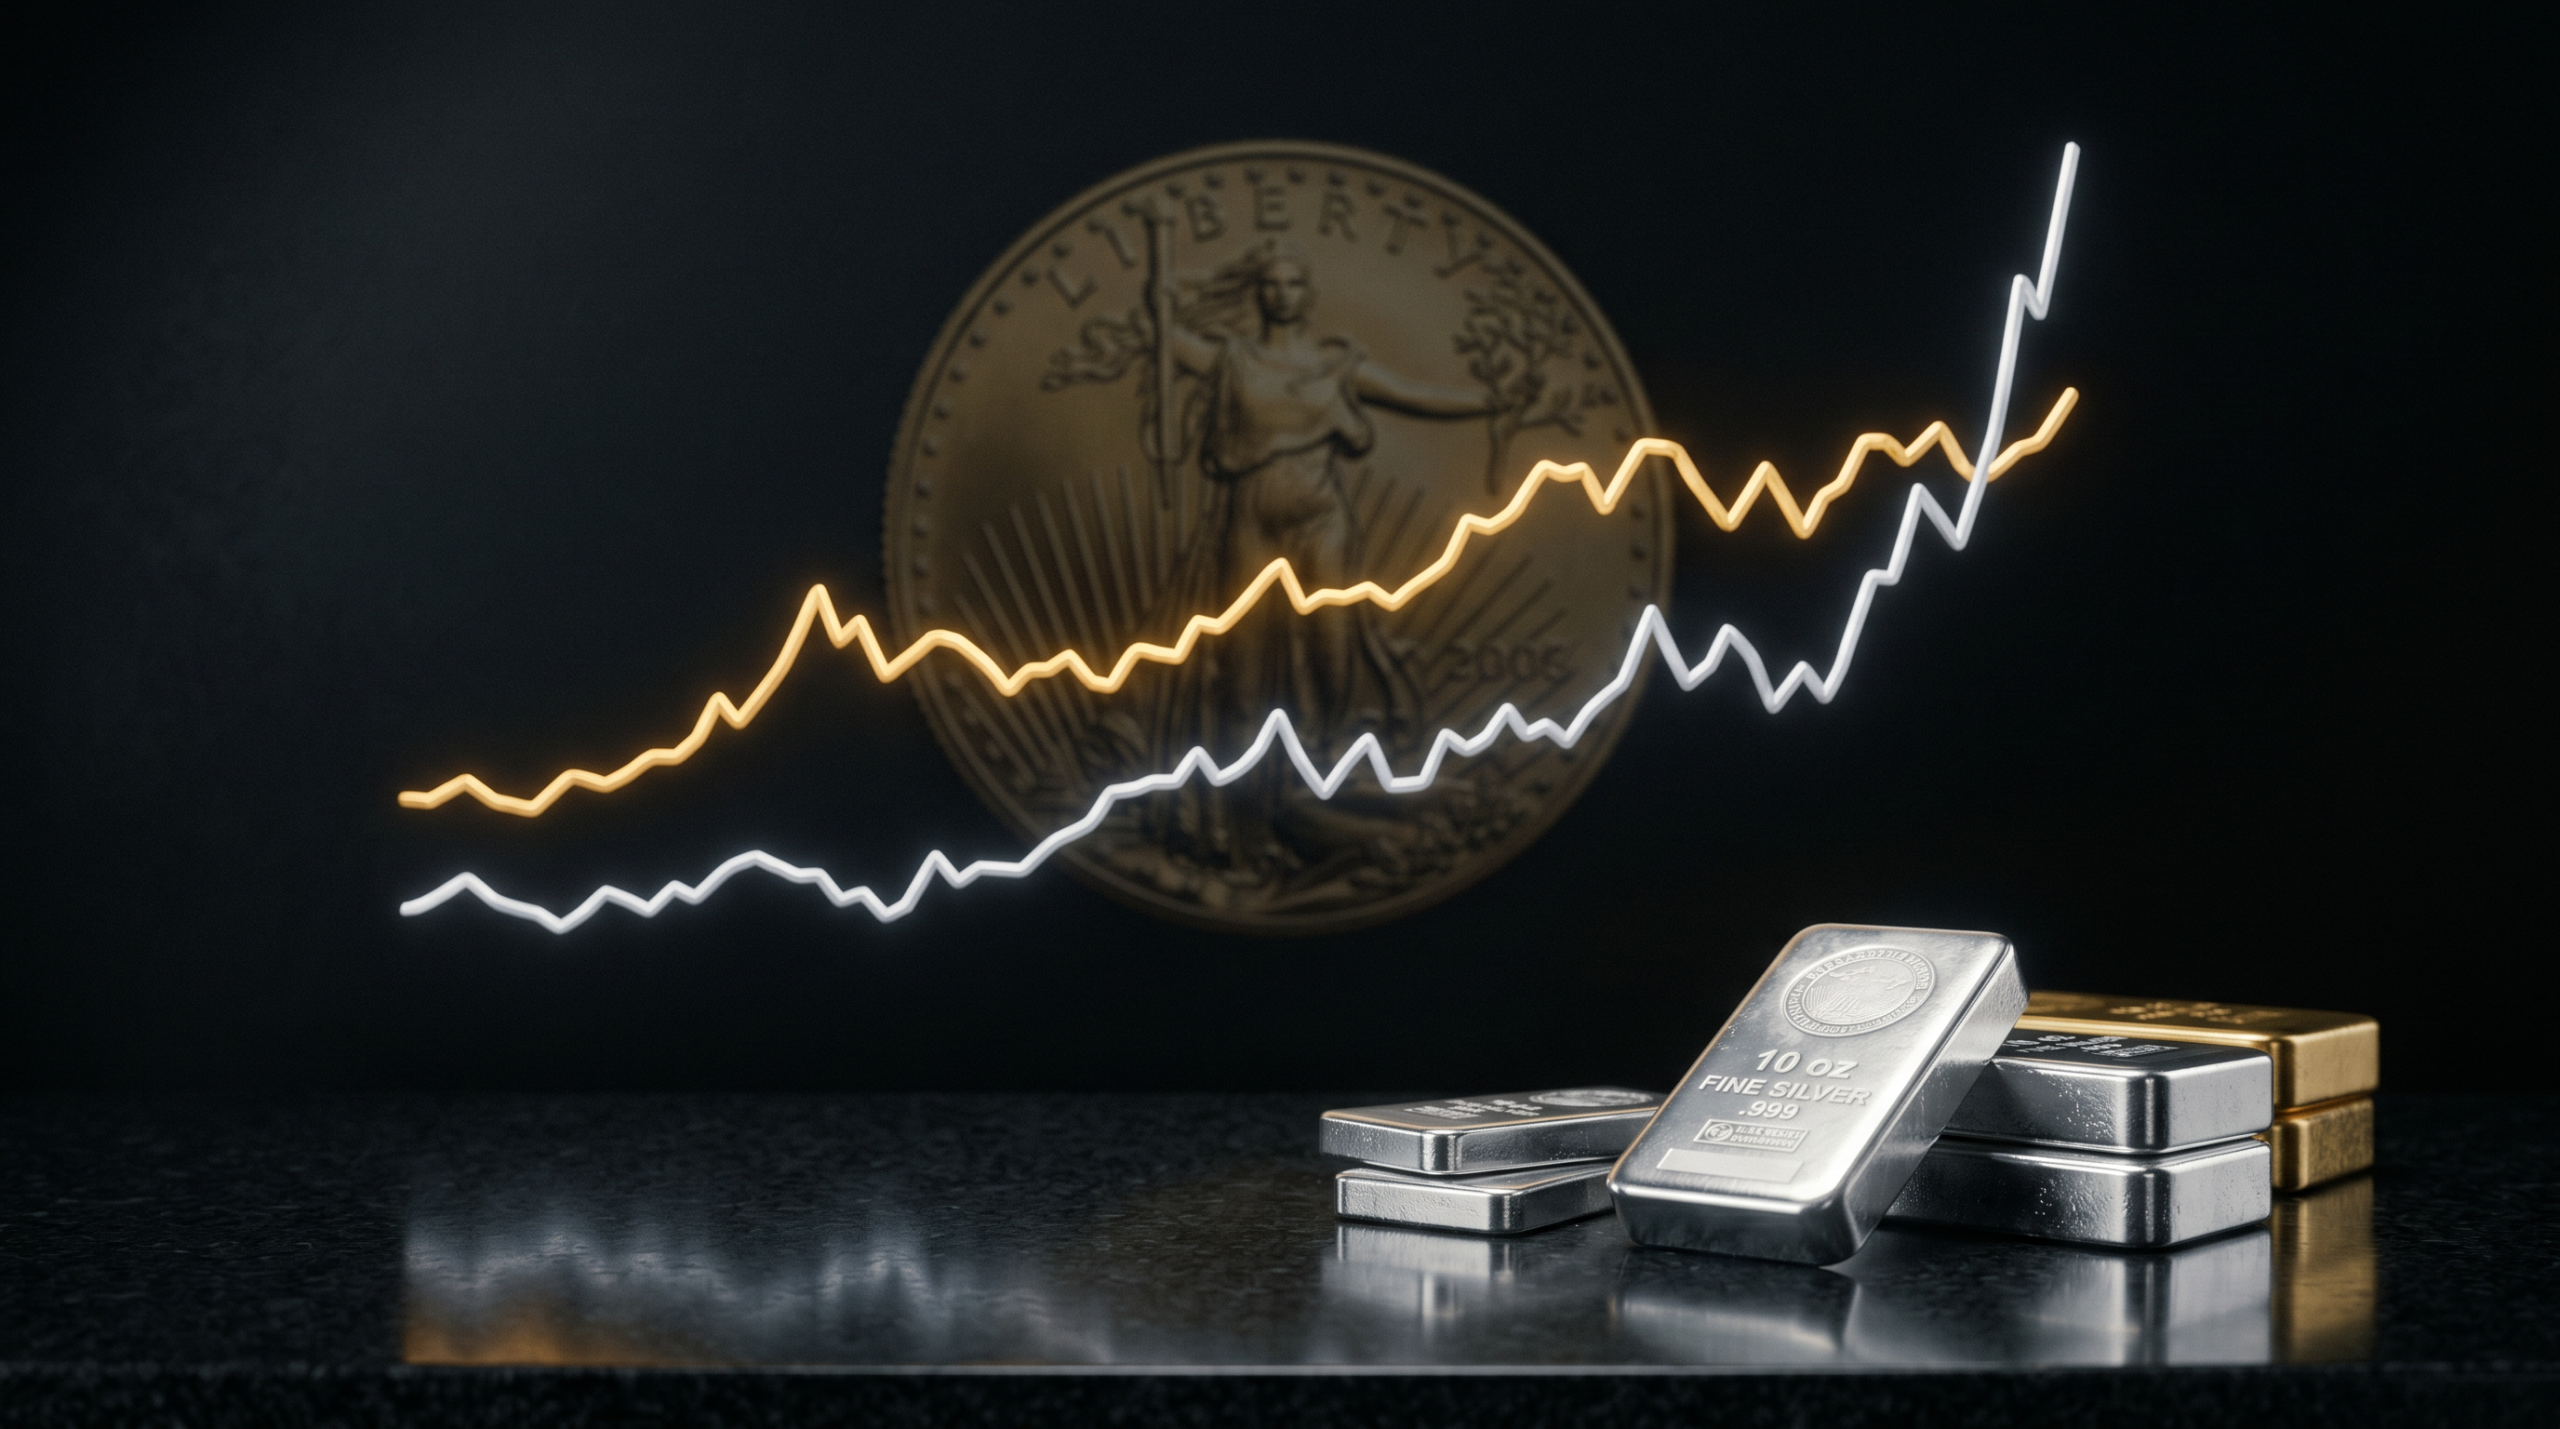
Spot silver printed an all-time high of approximately $95 in January 2026, roughly a week after gold’s peak. As of late April 2026, silver is trading near $70 — about 26% off the January high. The pullback in silver has been deeper in percentage terms than gold’s, which is normal. Silver is gold’s leveraged cousin in both directions. In a precious metals bull market, silver tends to outperform gold late. In a correction, silver corrects harder. That is a feature of the asset, not a flaw.
The relevant frame is not the 26% pullback. The relevant frame is the move from $24 in late 2023 to $95 in January 2026 — nearly a 4x move in roughly 26 months. Even after the recent correction, silver is up 118% over the trailing 12 months. That is a market that has done what silver does in the back half of a precious metals bull cycle: catch up to gold and then start to outperform it. The current correction is simply giving back a portion of that late-cycle outperformance. We’ve written extensively about this in why the volatility of precious metals should be viewed as a good thing — and the principle applies harder to silver than to anything else in the complex.
The retail and trade-shop tape tells the same story. Junk silver bag premiums, which compress when supply is plentiful and expand when retail demand outruns dealer inventory, have come off the highs but are still elevated relative to the 2022–2023 baseline. Silver American Eagle premiums have normalized. 100-oz bar premiums are tight. The market is functioning, supply is flowing, and that is exactly the kind of environment in which a thoughtful buyer can build a position without paying through the nose.
The gold/silver ratio: why this single number matters
The gold/silver ratio — the number of ounces of silver it takes to buy one ounce of gold — is the single most discussed metric in the precious metals world, and for good reason. It is the cleanest read on whether silver is cheap or expensive relative to gold.
The long-run historical average sits around 60. The modern era (post-1971) average is closer to 65. The ratio compressed to under 30 at the 1980 peak and at the 2011 peak — both moments when silver had run hard and was about to correct. The ratio has expanded to over 100 at moments of severe risk-off (March 2020 hit 125) and during periods when gold ran without silver participating.
At gold $4,577 and silver $70, the ratio sits at roughly 65. That is in the middle of the historical band — not at cycle-peak compression, not at cycle-trough expansion. The current ratio sits well above the readings that mark the end of a precious metals cycle. If the ratio simply normalizes to 50 with gold flat at current levels, silver is at $91. If it compresses to 40 with gold flat, silver is $114. And ratios in the 30–40 range are exactly where silver tends to find itself at cycle peaks.
The point is not to predict the exact ratio. The point is that the asymmetry is meaningful. Silver does not need gold to make a new high to deliver outsized returns. It only needs the ratio to compress, which is what happens late in every precious metals bull market without exception.
We covered the mechanics of this in why gold and silver buy rates don’t always move with the spot price and the dynamic is worth understanding before you buy. Silver premiums, ratio compression, and absolute price all move on different timelines, and the buyer who understands the differences makes better decisions.
The sixth consecutive annual deficit nobody is pricing
The Silver Institute’s 2026 outlook projects another global supply/demand deficit of approximately 67 million ounces this year. That makes 2026 the sixth consecutive year in which total demand has exceeded mine supply plus recycling. The cumulative six-year deficit now exceeds 850 million ounces — roughly the equivalent of a full year of global mine production drawn down from above-ground stocks.
The reason this matters is that silver is not like gold in one critical respect. Almost every ounce of gold ever mined still exists in some form, mostly in central bank vaults, jewelry, and bullion. Silver gets consumed industrially. It gets plated onto contacts, embedded in solar cells, and dispersed into electronics in ways that make recovery uneconomic at current prices. The above-ground stock of investable silver is a much smaller fraction of cumulative production than gold’s.
Mine supply is not responding. New silver mines take seven to ten years from discovery to first pour. Most silver is mined as a byproduct of copper, lead, and zinc — meaning silver supply growth is dictated by the economics of base metal mining, not the silver price. Even at $95 silver, primary silver miners are not bringing meaningful new supply online quickly. The pipeline simply does not exist.
What this means in practice is that the silver market has been quietly drawing down inventory for half a decade. COMEX registered inventories, LBMA vault stocks, and the major Asian exchange inventories have all compressed. The market has been able to clear at higher and higher prices because the marginal seller has been an above-ground stockpile, not a marginal mine. Stockpiles do not last forever, and the tightening COMEX inventory situation is increasingly being cited by analysts as the operational reality behind the more aggressive 2026 price targets.

Industrial demand: the more nuanced 2026 picture
The conversation about silver is dominated by the monetary thesis — and that thesis is real. But the industrial side of silver demand has gone through a structural step-change over the last five years that institutional and retail investors are still catching up to. The 2026 picture is more nuanced than the bull case often presents.
The Silver Institute projects total industrial fabrication will decline approximately 2% in 2026 to a four-year low of around 650 million ounces. That sounds like a bearish signal. It isn’t, and the why matters.
The decline is concentrated in solar photovoltaics, where ongoing thrifting (using less silver per cell) and outright substitution to copper-based pastes has compressed silver loadings faster than the unit volume of solar installations is growing. Global solar capacity additions remain at record levels. Silver per panel is falling. The net of those two forces is a small year-over-year decline in PV silver demand for the first time since 2016.
Other industrial buckets are more than offsetting that decline. AI data centers, which have absorbed an enormous fraction of global capex over the last 18 months, use silver in connectors, switches, and high-frequency components. Every meaningful AI infrastructure dollar that gets spent has a silver component embedded in it, and that component is growing. EV and hybrid vehicle electrical systems use 25–50 grams of silver per vehicle, and global EV plus hybrid production keeps grinding higher even as the all-electric narrative softens. Industrial silver demand outside of solar is up year-over-year by enough to offset most of the PV weakness.
The aggregate picture — total demand approximately flat, supply still constrained, sixth straight annual deficit — is bullish, not bearish. The composition shift away from solar and toward AI/electronics/auto is structural. Solar will eventually re-accelerate as the thrifting cycle exhausts itself. Until then, the rest of the industrial book is doing the work.
What institutional analysts are forecasting
The institutional consensus on silver has moved sharply higher over the last six months. The most aggressive numbers come from a handful of widely respected desks.
J.P. Morgan Global Research currently projects silver averaging $81/oz in 2026, with upside scenarios well above that. Bank of America and Citi have both raised year-end targets. The most aggressive published targets — reportedly up to $300/oz from BofA, Citi, and select Reuters-cited analysts in stress-test scenarios — are not base cases but illustrate the asymmetry visible at current price levels and inventory positions. More conservative desks are sitting in the $80–$100 range for year-end 2026.
Even the conservative end of that range is 14% above current spot. The middle of the range is 30–40% above current spot. The aggressive scenarios are 4x current. Whether you weight the consensus or the tail, silver at $70 is sitting below where serious institutional analysts think it should trade.
The tactical near-term: Fed, dollar, oil
The same Fed dynamic we walked through in our analysis of the April 29 FOMC decision applies to silver, but with a sharper edge. Silver is more sensitive to real rates than gold because silver has a meaningful industrial component that responds to global growth expectations. When the Fed is on hold and the dollar is range-bound, the macro headwind on silver is muted. When the Fed pivots to easing, silver tends to outperform gold by a wide margin.
The current setup has the Fed at 3.50–3.75% with markets pricing essentially zero rate moves through 2026 and a single 25-basis-point cut in December 2027. If the next cycle is “hold longer than expected, then cut harder than expected,” — which is a credible reading of the current Fed reaction function — silver is positioned to benefit asymmetrically. We laid out the same fiscal-monetary feedback loop in how monetary policy, debt and inflation will affect the price of gold and silver.
The dollar matters too. Recent dollar strength on the back of Iran-driven safe-haven flows and the hawkish dissent at the April FOMC has been a headwind for silver. If BRICS de-dollarization continues to grind forward and the trade-weighted dollar softens once geopolitical anxiety stabilizes, that headwind reverses into a tailwind.
Oil is the wildcard. The Iran war drove oil sharply higher and the World Bank is now forecasting a 24% jump in energy prices for 2026. Higher oil costs feed through to mining cost curves — diesel, energy-intensive ore processing, transportation. The marginal cost of producing an ounce of silver has moved up materially over the last six months. That puts a higher floor under silver price even if the speculative bid weakens.
What this means for buyers right now
The macro setup is constructive. The structural setup is asymmetric. The price is 26% off the highs. So how should an Atlanta-area buyer actually approach silver? Step one is the framing question we walk through with every new client — determine if you’re a coin collector or investor before your first purchase — because the answer changes everything that follows.
First, choose the right product for your goal. For investors building a meaningful position, the workhorses are American Silver Eagles, Canadian Silver Maples, 100-oz bars from approved refiners, and 1,000-oz Good Delivery bars for very large positions. We covered the product-selection logic in our ultimate guide on how to sell silver coins for the most value, and the same logic applies in reverse when you’re buying.
Second, mind the premium spread. Silver premiums on small-format products (Eagles, Maples, fractional rounds) move differently than premiums on bulk bars and junk silver bags. In tight retail markets, small-format premiums can run 15–25% over spot while bar premiums stay at 5–8%. That means a buyer focused purely on metal exposure should weight bars and junk silver. A buyer focused on resale liquidity at any size should pay the small-format premium for Eagles. Both can be right depending on your situation.
Third, dollar-cost average. Silver’s volatility is a feature for the patient buyer and a curse for the impatient one. Spreading purchases across weeks or months smooths the entry and removes the “did I buy at the top” tax on your decision-making. We wrote about this in why waiting for gold and silver prices to bottom is the wrong approach and in don’t try timing the market when buying or selling coins, and the discipline matters more in silver than in gold because the swings are bigger.
Fourth, decide on your gold/silver ratio target up front. If you are a ratio-driven investor, a useful framework is to overweight silver when the ratio is above 80, balance when it is 60–80, and underweight when it is below 50. At a current ratio of 65, the framework says “balanced to slightly silver-overweight.”
Fifth, work with a dealer who will tell you when to wait. The silver market has more retail-level dysfunction than the gold market — premium games, undisclosed substitutions on bulk lots, and inventory sourcing issues are all more common. Finding a trustworthy coin dealer matters more in silver than almost anywhere else.
What this means for sellers right now
Silver sellers face a different calculation than gold sellers. Silver is sitting near multi-year highs in absolute terms even after the correction. A position established in 2020 at $20 silver is up roughly 250% at $70. A position established in 2023 at $24 is up roughly 190%. Those are not numbers you ignore.
For sellers reviewing inherited collections or estate accumulations, the key question is product mix. A typical estate collection of mixed silver — Morgan and Peace dollars, junk silver halves and quarters, mint sets, and assorted bars — has very different sale economics than a pure bullion stack. Numismatic premium on key-date Morgans can substantially exceed melt value, and the right buyer for those coins is not the same as the right buyer for 100-oz bars. We covered the framework in your ultimate guide to a successful estate coin collection appraisal and in how to evaluate your coin collection properly.
For investors looking to harvest gains, the question is partial sale versus full liquidation. Most of the investors we work with are not selling everything — they are reducing a position that has grown beyond their target allocation back to the target. A 10% portfolio allocation that has grown to 22% because silver has run is a candidate for trim, not for full exit. Trimming and rebalancing into other asset classes (or into gold, where the gold/silver ratio framework would suggest is currently the cheaper metal in relative terms) is a legitimate strategy.
For all sellers, the reporting framework we walked through in do I have to report my gold and silver coin sales to IRS applies. Silver-specific reporting thresholds differ from gold, and bulk silver bar sales above certain volumes trigger 1099-B reporting that single-coin sales do not. Know the threshold before you walk in for a sale, and talk to your CPA about the tax treatment of any gain.
Putting it together: the silver frame
The silver thesis for the rest of 2026 is built on three pillars that are independently strong and collectively asymmetric. The gold/silver ratio at 65 is well above the levels that mark cycle peaks, with substantial room to compress. The market is in its sixth consecutive year of structural deficit, with cumulative draws now exceeding 850 million ounces and COMEX inventories tightening into a backdrop where the marginal seller is an exhaustible above-ground stockpile rather than a marginal mine. And institutional price targets — J.P. Morgan at $81, others materially higher — sit well above current spot.
None of those three pillars are fragile. The ratio is mean-reverting over decades. The deficit is grounded in real bills of materials, not in narrative. The institutional targets are verifiable and increasingly aggressive.
The right mental model for a silver buyer is the same one that applies to gold, with a sharper risk profile. Build the position over time, not in a single trade. Pick products that match your goal and your liquidity needs. Pay attention to the premium spread as much as the spot price. And size the position to your actual conviction, not to your fear of missing out.
For sellers, silver’s outperformance late in the cycle creates a real opportunity to harvest gains and rebalance. The question is not “is silver going higher” — the structural setup says it almost certainly will. The question is “does the current price serve my actual portfolio goal better than holding through more volatility.” For most investors with meaningful unrealized gains, partial trims are a sound discipline regardless of where you think the next 20% goes.
In our final installment we move to platinum and palladium — the two precious metals that get the least attention and that are sitting in some of the most interesting setups of the four. Platinum just printed its deepest annual deficit in over a decade. Palladium is up nearly 60% year-over-year on the back of EV-transition slowdown and Russian supply disruption. We will walk through the supply, demand, and substitution dynamics, and close with the practical playbook for buyers and sellers across the full metals complex.
If you have questions about silver specifically, would like an appraisal of a silver position or estate collection, or want guidance on building or trimming a position in the current environment, please reach out anytime. Atlanta Gold and Coin has been serving the Atlanta metro and clients nationwide for nearly two decades.
The views in this post are general market commentary and not personalized investment advice. Atlanta Gold and Coin is a precious metals dealer, not a registered investment advisor. Consult your CPA, tax professional, or financial advisor for guidance specific to your situation.